


Much like reports, the Dashboard allows you to quickly see information about your sales, purchases and inventory. The main graph can provide visual representations of your sales totals, cost totals etc.
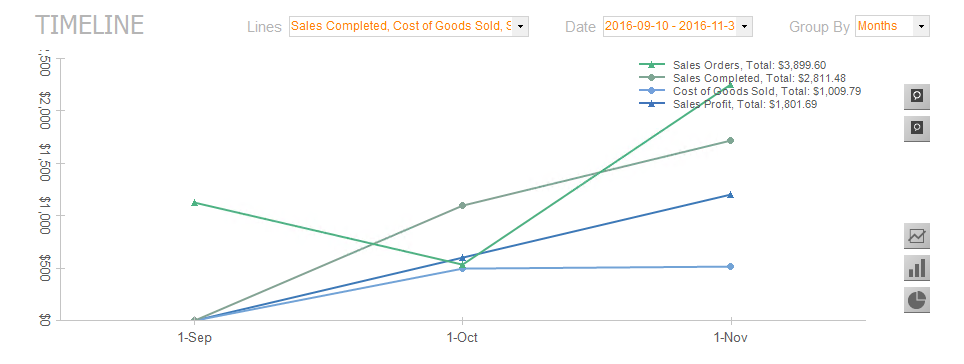

Using the drop-down selections at the top of the screen, you can choose to show different information and the graph type can be controlled using the buttons on the right. Items of interest will appear along the bottom of the dashboard so you can quickly see what requires your action.
Outstanding sales, purchase and work orders as well as products to reorder can easily be accessed in the bottom left hand corner of the screen.
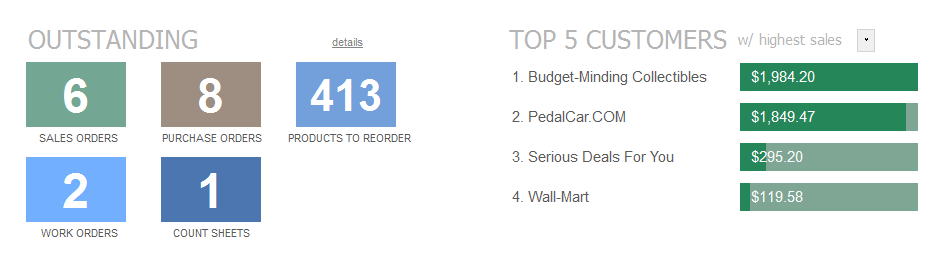

The Top 5 list on the right can show you any number of statistics at a glance, for example the top five vendors your company purchases from, the top five products that sell the quickest, your most active customers or (as in the example above) the top five products in stock. You can also change the number (it can be top 10, top 20, etc).